You can create your own analysis report in the “Results” unit and in the “My reports” tab!
To get started, click on “Create a new report from scratch” if you want to start from a blank page, or click on “Use an automatically generated report” if you want to start from a base that you can modify later.
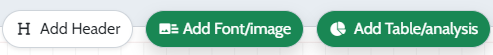
Click on buttons to add an element to your report. Different options are available to you.
Adding a header
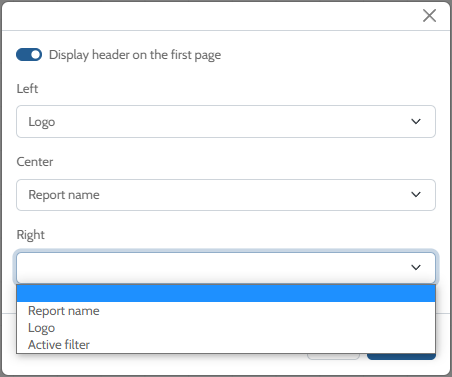
You can add a header on the pages of your report.
You can add an available item in your header by selecting it in the drop down menu on each space (left, middle, right). You have the choice between the title of your report, the logo of your survey or the name of the active filter.
You have the possibility to apply your header on every pages of your report by activating the “Display header on the first page” option, or starting from the second page by deactivating that option. Click on “Confirm” once you have selected all the elements that you need.
Adding a text or an image
You can insert font and images in your report by clicking on “Font/Image”.
Then, you will have access to different elements to edit your text, insert URL link and images.
Adding an analysis
You have the possibility to add different types of analysis, set filters and edit your analysis.
Analysis
- Select the type of element(s) to analyze (Question, Multiscoring, Group)
- Select the element(s) to analyze with the drop down menu
If you conduct a comparative analysis, activate the “Conduct a Comparative Analysis” option and select the element you want to compare (question, filter,…).
- Select the type of analysis to apply
- Click on “Confirm”
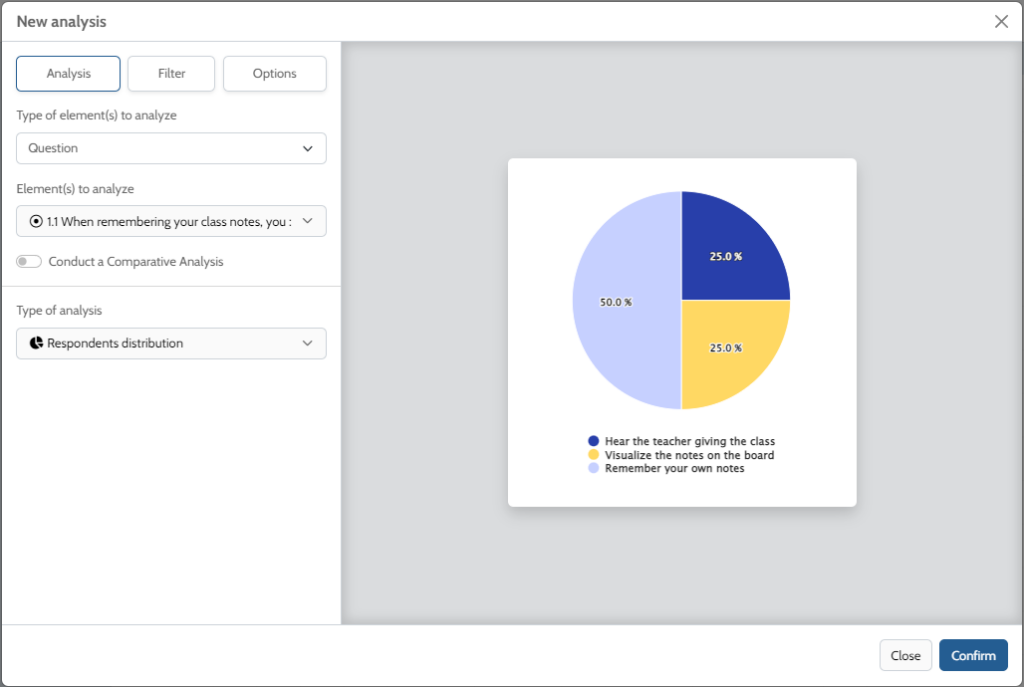
Different types of analysis are available to you, such as the respondent distribution, the number of respondent, the number of response by choice, minimum/average/maximum, the average, and more!
Note: The types of analysis available are the one adapted to the type of question selected to be analyzed.
Filter
You can apply a filter already created or create a new filter by clicking on “Add a filter”. You can find an explanation about how to set a filter here.
Select your filter and click on “Confirm”.
Options
You can custom your analysis in the “Options” tab.
You can add a title to your analysis. You can either write your own title or insert a title (element(s) to analyse, type of analysis, filter) by clicking on the arrow that displays a drop down menu. You can redo that operation for the subtitle.
Finaly, you can apply a color palette on your graph by clicking on the drop down menu of the “Colors” option. Then, select the one you wish to use.
Once your editing is done, click on “Confirm”.
Question group
The advanced “Question group” functionality (accessible from a PRO+ or PRO+ team account) allows you to analyze a group of similar questions. By grouping questions, you will be able to generate tables and graphs based on this group.
Note: The questions in a group must be similar for the analysis to be coherent. For example, you can group scales, sliders, emoticons, ratings questions.
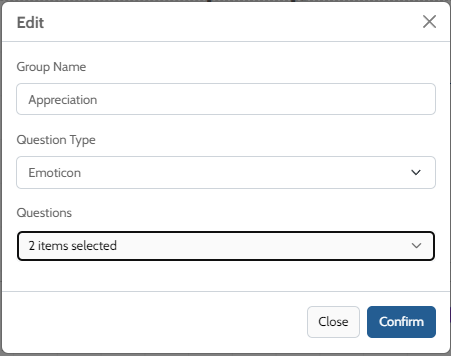
To create a new group:
- Click on “Group question” then click on “New group”
- Name your group and select the type of question
- Select the question(s) you wish to add to the group
- Click on “Confirm”
Then, you can analyze your groups of questions in the “Analysis” tab by selecting those gorups in “Type of element(s) to analyze”.
Editing your report
Different editing options are available to you.
Pages of report
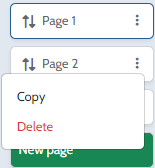
You can add many pages on your report by clicking on the green “New page” button. You can reorganize your pages by clicking on the two arrows and moving your page up or down.
You can duplicate or delete an active page by clicking on the three dots on the right of your page and by clicking on “Copy” or “Delete”.
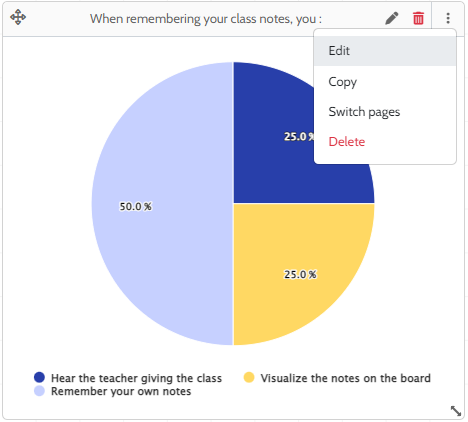
Elements of analysis
You can also edit your elements of analysis. You can use your mouse to move them around your page. By clicking on the three dots , you can edit, duplicate, switch pages your element. In addition, you can use the pen to edit your element and delete it by clicking on the red trash.
Once you finished setting your report, you have the possibility to export and share it.