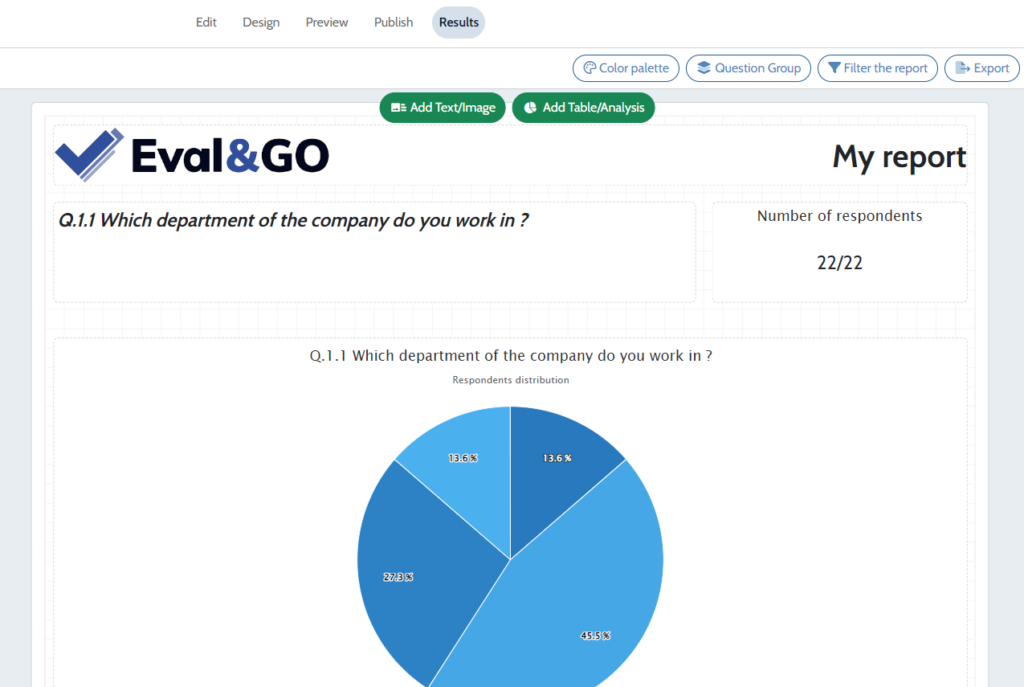
Offering a report of analysis at the end of the questionnaire can be an excellent way to provide immediate feedback to respondents. Whether it’s a summary of the overall results or a personalized analysis (like a personality test or self-diagnosis), this feature provides instant data visualization.
Here’s how to set it up in your questionnaire.
1. Create a report in the Results module
- Go to the Results module and click on the My Reports tab.
- Create a new report and then customize it by adding the desired analysis elements (tables, graphs, text, etc.).
- You can adjust the layout, colors and more to make the report match your expectations.

2. Set the closing page
- Go to the Edit module and open the Closing Page

- Click on the See Results Report button to add this button to your end page.

3. Customize the button
- You can customize the button name and color to match your questionnaire design.

4. Select the report
- Then choose the report you want to show to respondents.
- If you want each respondent to see only their own results (useful for personality tests, self-diagnostics, etc.), enable the Filter the report by the current respondent (dynamic filter).

5. Validate
- Once your configurations are complete, confirm the changes and the button will be automatically added to the end page of your questionnaire.
This will allow your respondents to see either a global report of the results or an individual report based on your preferences.
